

The Opti-mized Dashboard
Powerful Intelligence. Shockingly Simple to Use.
Facilities are high-cost machines — running 24/7 with dozens (sometimes hundreds) of systems operating behind the scenes. HVAC, lighting, pumps, fans, plugs — all influenced by weather, hours, aging parts, and poor visibility.


Trusted by


No Complexity.
Just Instant Understanding
The SmartSence dashboard turns complex energy data into clear, visual insights—so you can make confident decisions without spreadsheets, guesswork, or training. Everything is laid out in a way that just makes sense—from the moment you log in.

Visual Insights Made Simple
Color-coded graphs, intuitive layouts, and instant highlights make it easy to spot trends and energy issues—no training required.

Chat With Your Facility
Ask natural questions like “Where is energy being wasted right now?” and get instant, plain-language answers powered by live circuit data.

Organized by Facility, Panel & Circuit
Navigate your data exactly how your building is wired. Everything is structured to mirror your actual facility setup.

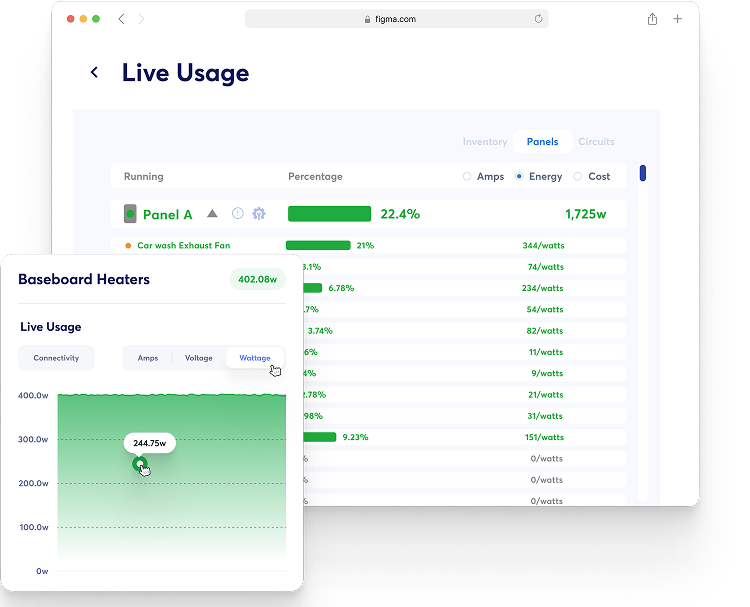
Real-Time Circuit Monitoring
See what every circuit and asset is doing, second-by-second—no blind spots, no waiting, total visibility.

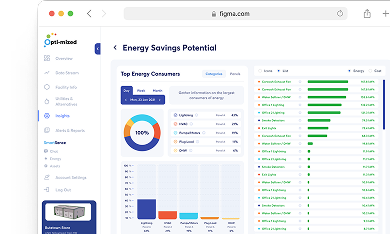
Guided Energy Insights
Don’t know where to start? SmartSence highlights what matters most—so you always know where energy savings can be found.

Clear Reporting, No Jargon
Auto-generated PDF reports with visuals, circuit-level breakdowns, and easy-to-understand summaries—perfect for teams and decision-makers.


Inside the Dashboard
A quick look at what makes running your facilities interactive, visual, and totally stress-free.
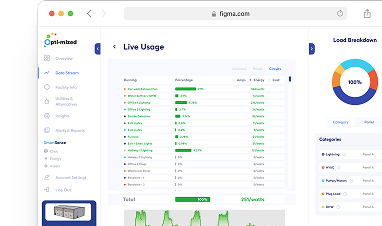
Facility Overview
Instantly see which buildings are performing well—and which need attention.
Circuit-Level Monitoring
Live, second-by-second visibility into each piece of equipment.
Facility Overview
Instantly see which buildings are performing well—and which need attention.
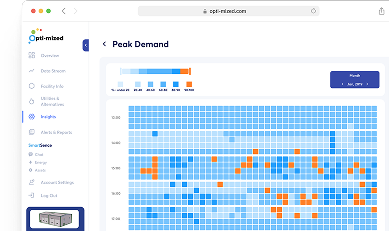
Usage Breakdowns
Explore energy usage by day, week, or month—all clearly visualized.
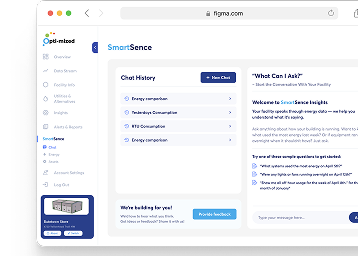
Chat With Your Facility
Ask questions like “Where am I wasting energy today?” and get instant, plain-language answers powered by live data.
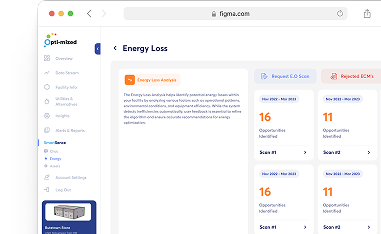
Energy Loss Summary
Automatically identifies where energy is being wasted—factoring in weather, operating hours, and equipment behavior.
Real Stories.
Real People.
Here’s what they have to say about their experience with us—real stories from real people who made us part of their journey.


“It’s the only dashboard my whole team actually uses—and understands.”
– Kristen
Municipal Energy Coordinator
“We uncovered over 21% in energy loss—at no cost. Total game changer for our operations.”
– Denis
Public Works Lead
“SmartSence gave us clarity we didn’t even know we were missing. It’s like someone turned the lights on for our energy strategy.”
– Caleb
Facility Manager
Taking Pre-Order
for Fall 2025
Lorem ipsum dolor sit amet, consectetur adipiscing elit, sed do eiusmod tempor incididunt ut labore et dolore magna aliqua. Ut enim ad minim veniam, quis nostrud.
Limited Amount. Preorders are limited in quantity and available on a first-come, first-served basis. Once the limit is reached, no additional preorders will be accepted. Don’t miss your chance—reserve yours while supplies last!